Literature review
Together with Anke Brock, we proposed an exhaustive review of interactive maps for visually impaired users, as well as a new classification.
Collaborators and/or co-authors: Anke Brock, Christophe Jouffrais.
Publications / videos
In short
This work is an attempt to structure the work that had been conducted on accessible interactive maps. It provides an exhaustive list of interactive maps prototypes, from the earliest, proposed by Parkes in 1988, to prototypes designed in 2016. It also describes a new classification. It is based on Anke Brock’s thesis dissertation. In my thesis, I extended this classification to accessible diagrams.
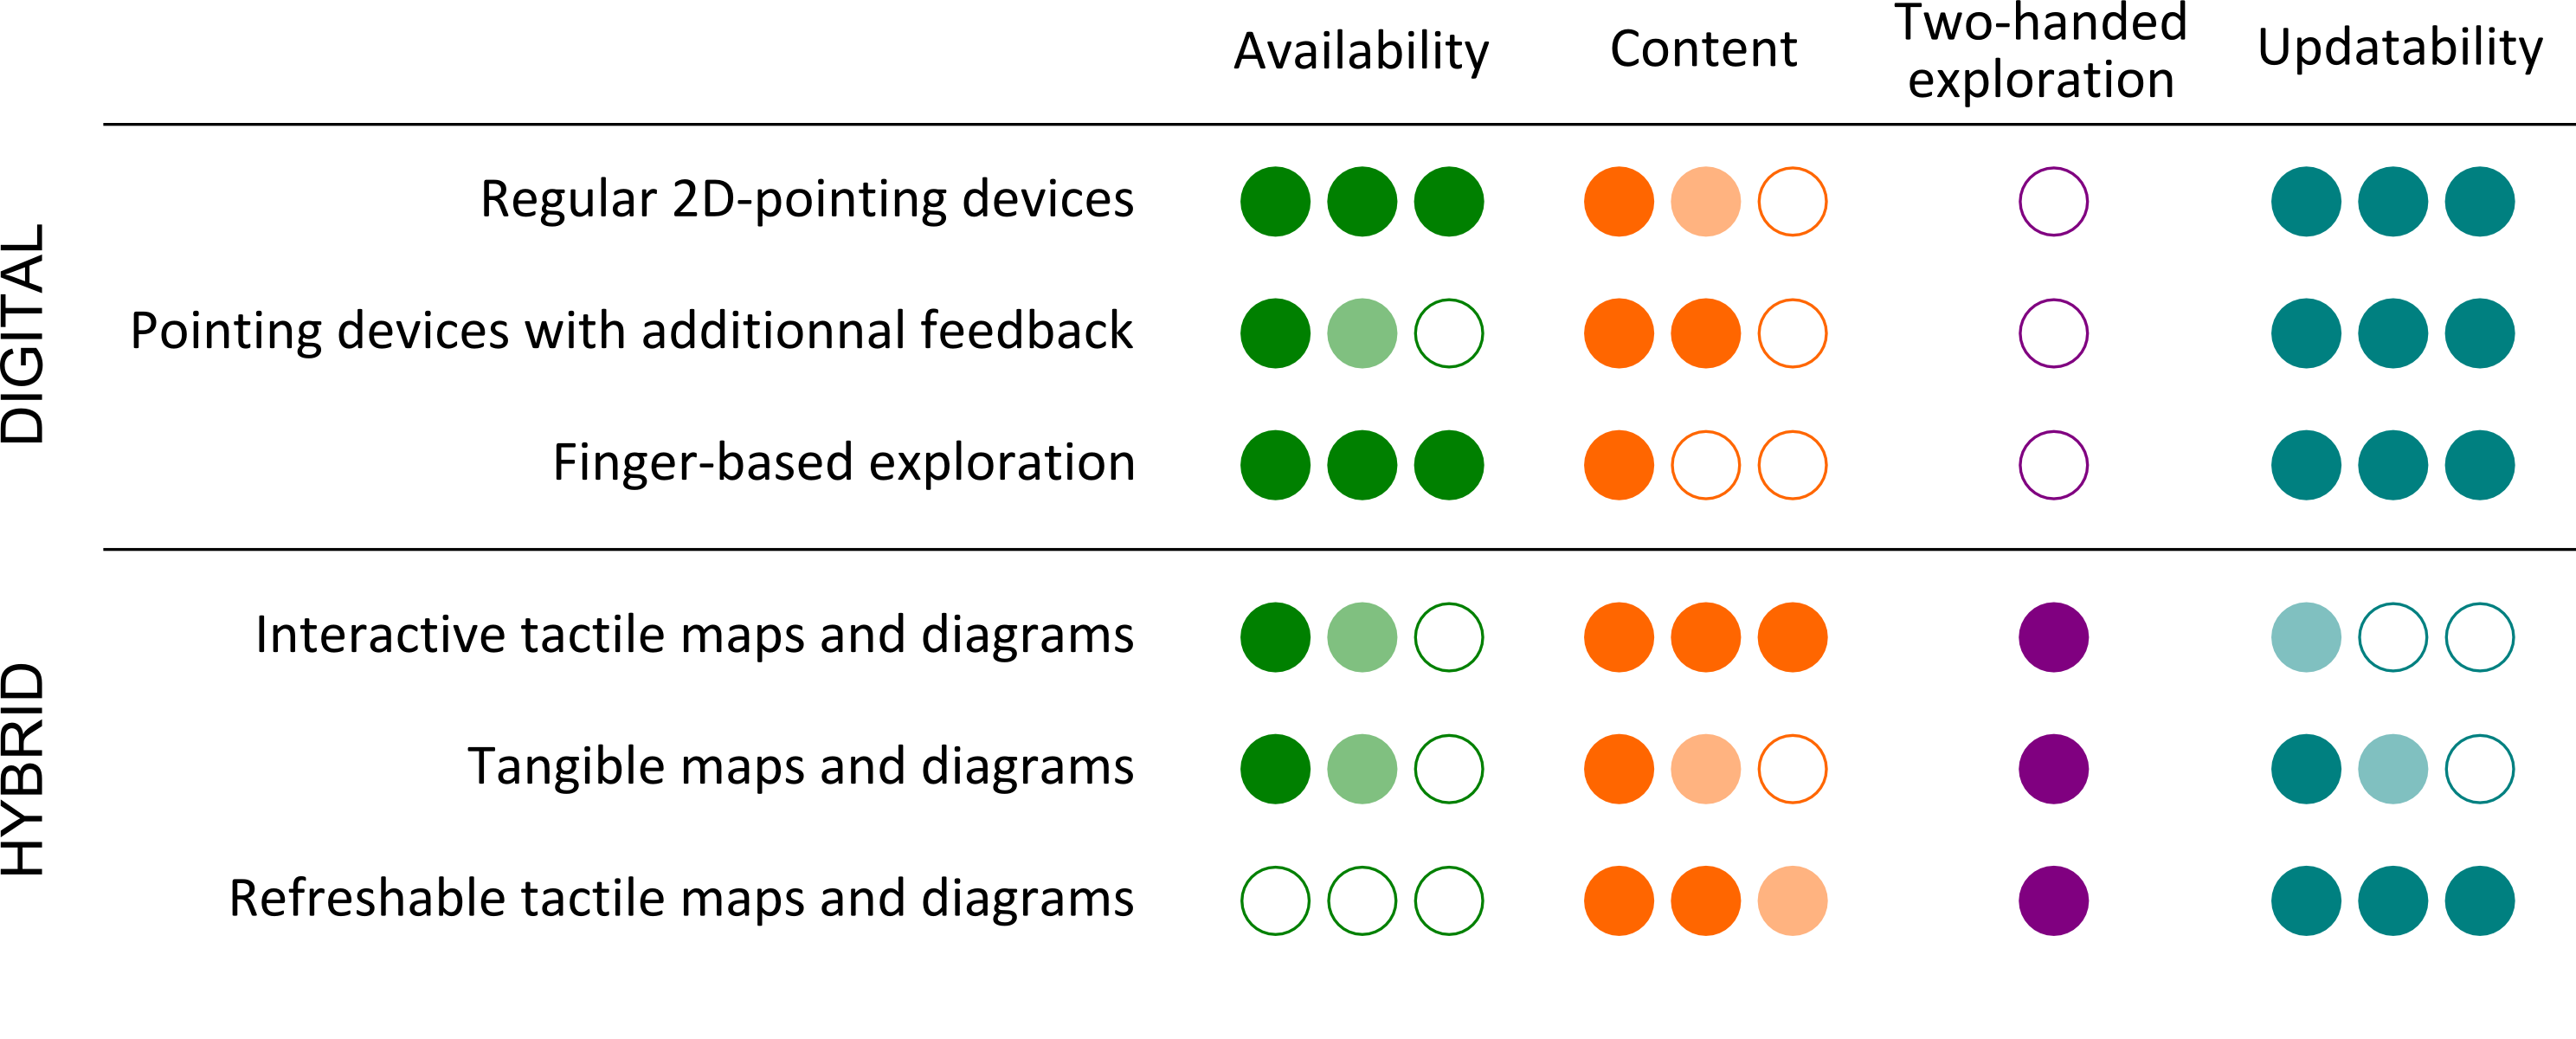
Digital maps and diagrams can be displayed on a screen or projected onto a flat surface. They can be explored with one or two points of contact, which are either direct (e.g. fingertips) or indirect (e.g. the cursor of a mouse). More precisely, digital maps can be explored by:
- regular devices (keyboard, joystick, tangible pointing devices)
- pointing devices with additionnal force feedback(mice, gamepads and joysticks, handles) or cutaneous feedback (e.g. mice augmented with Braille cell)
- one of the user’s fingers that can be tracked by touch-enabled device (e.g. a tablet) or by a camera-based system.
Hybrid maps and diagrams are made of a digital and a physical representation:
- interactive tactile maps and diagrams rely on a tactile graphic and the user’s fingers can be tracked by a touch-enabled device or a camera-based system.
- tangible maps and diagrams are made of several physical objects that represent elements (e.g. landmarks on a map, data points on a graph).
- refreshable tactile maps and diagrams are physically rendered (for example using a matrix of pins), and can be dynamically updated by the system.